Healthy Adult, 31-year old male
Night 1


Night 2


Night 1


Night 2


Baseline Night
Caffeine Night

- Healthy sleep pattern.
- Subject had no issues falling asleep.
- Consolidated stable sleep through the night.
Baseline | Caffeine | |
|---|---|---|
Baseline 78 | SQI | Caffeine 66 |
Baseline 89% | Efficiency | Caffeine 81% |
Baseline 84% | Stable | Caffeine 72% |
Baseline 6% | Unstable | Caffeine 14% |
Baseline 3% | Fragmentation | Caffeine 8% |
Baseline 57 min | WASO | Caffeine 1h:29m |
- One cup of strong coffee was consumed at 07:00PM.
- Stable sleep onset is not until 2.5 hours into the sleep period.
- Movements are increased during this long sleep latency period.
- Noticeably fragmented sleep for the rest of the night compared to baseline night.
Adult OSA


Paediatric OSA


Complex Sleep Apnea


Central Sleep Apnea & Atrial Fibrillation
Presence of CSA indicated by prevalent Periodicity, confirmed by CAI of 24 scored by PSG.
Study produced a clear spectrogram due to strong respiratory component, despite the presence of AF.


Insomnia


Additional Information
About SleepImage
The SleepImage System is Food and Drug Administration (FDA) cleared Software as a Medical Device (SaMD) that establishes Sleep Quality and measures Sleep Duration.
The technology is based on Cardiopulmonary Coupling (CPC) analysis of data, typically collected during sleep, derived from electrocardiogram (ECG) or photoplethysmogram (PPG) sensors.
The SleepImage System is intended for use by or on the order of a Healthcare Professional to aid in the evaluation and management of sleep disorders in children and adults.
The SleepImage System optionally analyzes SpO2 data to measure oxygen desaturation and calculate the SleepImage Apnea Hypopnea Index (sAHI) that is FDA-cleared to aid clinical diagnosis and management of Sleep Disordered Breathing (SDB) in children and adults.
The SleepImage System is patented, cloud-based and Health Insurance Portability and Accountability Act (HIPAA) compliant software. The SleepImage System optionally graphs accelerometer data, and when recorded on the torso, it can calculate and display body position and snoring.
The SleepImage System output is automatically generated and presented in an easy to understand manner, with test results for each biomarker displayed and color coded along with expected values for health care professionals to aid sleep disorder evaluation, diagnosis and management.
The SleepImage System is designed for multi-disciplinary care including non-sleep specialized clinicians for prevention or management of chronic diseases related to poor sleep quality, or presence of sleep disorders.
The SleepImage Output
The SleepImage output is fully automated and presented in tables and graphs with color-coded expected values to aid sleep disorder evaluation, diagnosis and management. Multi-night studies are shown on trend graphs and Clinicians can write notes and make recommendations for further testing, evaluation, and treatment. Clinicians furthermore have access to the raw data for evaluation and an ability to adjust the study period to recalculate the automated output values.
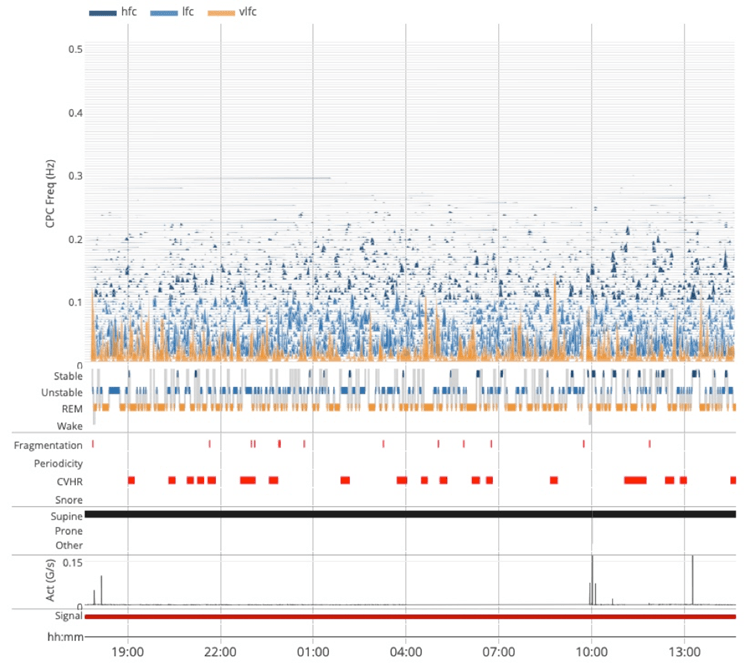
The Sleep Spectrogram is an intuitive overview of the sleep period with biomarkers of sleep quality and sleep pathology to provide a new and practical approach to trend sleep as a vital sign of health over time and to identify and manage sleep disorders.
SleepImage is a useful clinical tool, whether it is to evaluate symptoms of Insomnia, aid diagnosis of Sleep Disordered Breathing (SDB) or track treatment. The SleepImage analysis is based on data collected with either an electrocardiogram (ECG) or photoplethysmogram (PPG) sensor during sleep. Both signals contain information/data on heart (pulse) rate variability (HRV/PRV) as a measure of autonomic drive (sympathetic and parasympathetic) and respiration, that both are strongly modulated by sleep.
The SleepImage software utilizes mathematical and frequency analysis to calculate the synchronization between HRV/PRV and respiration to provide visualization of sleep in the Sleep Spectrogram that is reported numerically as Sleep Quality, Sleep Duration, Sleep Apnea, Fragmentation and Periodicity.
Sleep Quality Index (SQI) is a summary index of the CPC biomarkers that provides a meaningful unit of measure of sleep health. The SQI is displayed on a scale of 0-100 and with expected values for both children and adults. The SQI can be used as a “unit of measure” for sleep health that is useful to track sleep health over time, whether to identify the need for further clinical investigation or to track therapy. The SQI is easily communicated and relatable for the patient or other lay persons, while at the same time being a summary measure of sleep health that has been clinically validated and FDA-cleared.
Sleep Apnea Indicator (SAI) provides a measure of SDB and is based on detecting oscillations in cardiac intervals associated with prolonged cycles of sleep apnea, based on Cyclic Variation of Heart Rate (CVHR) during unstable breathing (tidal volume fluctuations in breathing). During each apnea event, blood oxygen decreases and is accompanied by a physiological reaction of bradycardia and, when breathing resumes, a relative tachycardia and thus reflecting hypoxemia. When SAI is presented with the Sleep Quality Index, Fragmentation and Periodicity, it is possible to use the SAI to not only help detect apneas, but also to differentiate between obstructive, central and complex/mixed sleep apnea.
Apnea Hypopnea Index (sAHI) is an automated measure of Apnea/Hypopnea events, following the American Academy of Sleep Medicine (AASM) scoring guidelines of the Apnea Hypopnea Index (AHI) for both adults and children, as mild, moderate and severe sleep apnea. When blood oxygenation data (SpO2) is recorded, the SleepImage System automatically analyzes the SpO2 data to generate desaturation events, display an SpO2 graph and automatically calculate SleepImage Apnea Hypopnea Index (sAHI) by combining other CPC-biomarkers and hypoxic events during sleep time measured by CPC. The automatically generated sAHI is FDA-cleared to be comparable to AHI scoring from polysomnography (PSG) studies to aid diagnosis of Sleep Disordered Breathing (SDB) in both children and adults.
Fragmentation (eLFCBB) is a subset of low-frequency coupling, it is an indicator of pain, upper airway resistance and Obstructive Sleep Apnea (OSA).
Periodicity (eLFCNB) is a subset of low-frequency coupling, it is an indicator of periodic type breathing and Central Sleep Apnea (CSA).
sAHI & AHI
The SleepImage Apnea Hypopnea Index (sAHI) is an automated measure of Apnea/Hypopnea events, following the American Academy of Sleep Medicine (AASM) scoring guidelines of the Apnea Hypopnea Index (AHI) for both adults and children as mild, moderate and severe sleep apnea. When blood oxygenation (SpO2) data is recorded, the SleepImage System analyzes the SpO2 data to generate desaturation events, display an SpO2 graph and automatically calculate SleepImage Apnea Hypopnea Index (sAHI) by combining other Cardiopulmonary Coupling (CPC) biomarkers and hypoxic events during sleep time measured by CPC. The automatically generated sAHI is FDA-cleared to be comparable to AHI scoring from polysomnography (PSG) studies to aid diagnosis of Sleep Disordered Breathing (SDB) in both children and adults.
The sAHI, like the AHI, reports the number of paused breathing events during the sleep period. Events are displayed based on CPC sleep states (Stable and Unstable NREM sleep and REM sleep). Additionally, events are presented concurrently with and without cyclic variation of heart rate (CVHR) to aid in clinical interpretations and management of SDB. When reviewing the overall sAHI score, it is recommended to consider SDB events concurrent with CPC sleep states to evaluate and determine disease severity and for differential diagnosis of Obstructive (OSA), Central (CSA) or Complex/Mixed Sleep Apnea, using the pathology biomarkers of Fragmentation (elevated low-frequency coupling broad band, eLFCBB), that is associated with obstruction and Periodicity (elevated low-frequency coupling narrow band, eLFCNB), that is associated with periodic breathing.
Signal Quality
Signal Loss
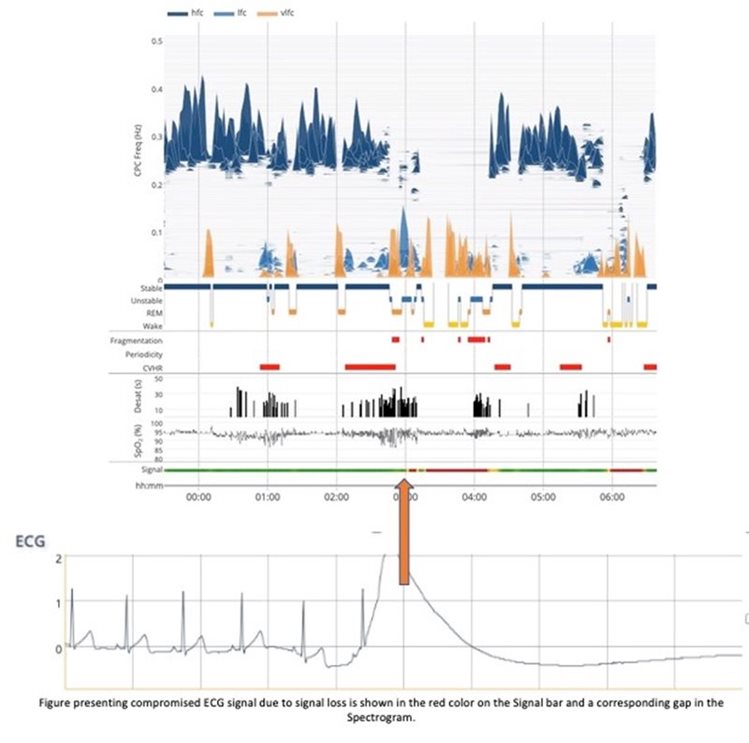
Clinical interpretation should be constrained to areas of good signal quality to ensure meaningful data interpretation and it is recommended to base clinical decisions on studies containing at least 4 hours of green signal. CPC signal quality is shown on the Signal Quality Line presented below the spectrogram.
A compromised signal is shown as yellow (when there is some noise, but the signal has still mostly normal sinus rhythm) or red (when the signal has lost sinus rhythm or there is no signal). When there is no data, there is a gap in the spectrogram and there is no CPC output.
As shown in the example to the left (using ECG), at ~3:00 am Signal Quality turns red and the Spectrogram shows a corresponding loss of data. The same applies for PLETH signal loss.
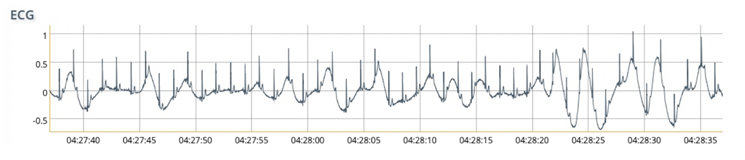
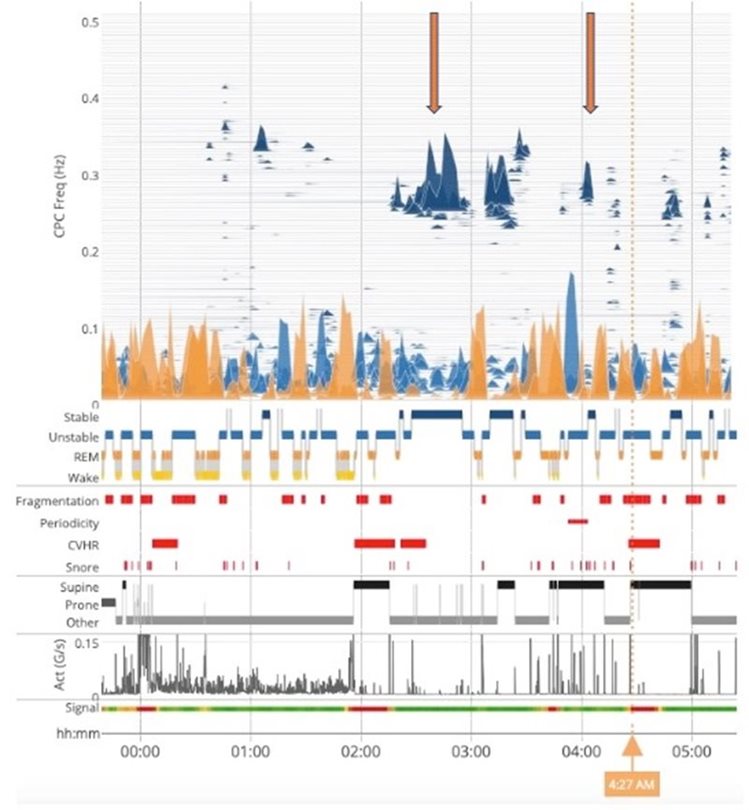
Signal Artifacts
A poor quality ECG or PLETH signal leads to failed feature detection in the signal and provides poor data for coupling. The Spectrogram often shows LFC or vLFC during such periods. In this case (4:27AM), the signal is marked as red and is therefore of limited clinical value.
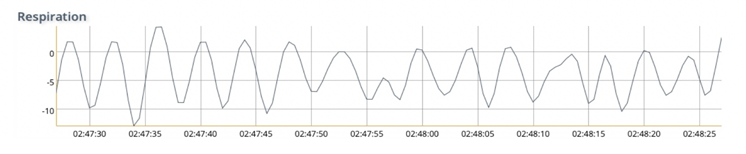
ECG & Respiration artifact due to distorted baseline
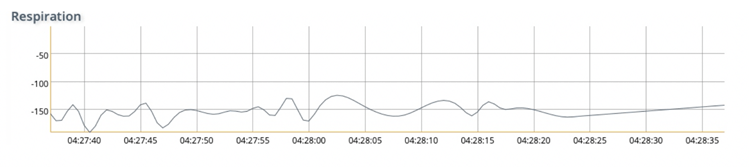
ECG & Respiration during a period of good signal
ECG Abnormalities
The following is not a comprehensive list of ECG abnormalities and is only intended as examples of how abnormalities can affect SleepImage output. This is not intended as a guide to identify and/or diagnose ECG abnormalities of any kind.
ECG abnormalities and irregularities in heart rate can affect the automated feature detection of the ECG/PPG signal, which is reported by the Signal Quality Line as yellow, amber, and red.
Premature Atrial Contractions (PACs)
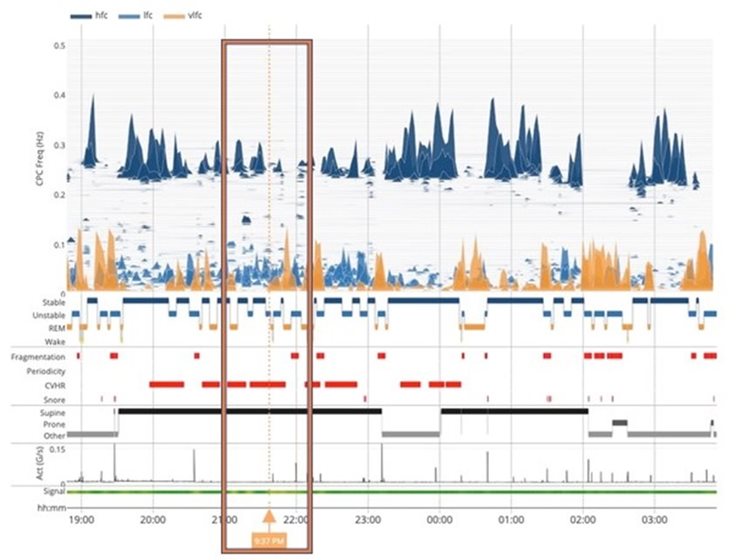
PACs are a common cardiac dysrhythmia characterized by premature heartbeats originating in the atria. They are most often asymptomatic and are not considered an abnormal finding but as they cause irregular heartbeat, they can interfere with the CPC algorithm and cause the Signal Quality to turn from green to yellow or red. The result on the Spectrogram is “noisy” causing the clear separation between stable and unstable sleep to disappear during periods when the ECG signal is compromised causing deteriorated signal quality with LFC dominating the picture during periods of irregular heartbeat.
The figure (right) presents sections of “noisy” spectrogram where clear separation between Stable and Unstable sleep disappears during periods where the Signal Quality Line is yellow, in this case as a result of irregular heart rate (PAC).
The prevalence of PACs during the report period will determine the usability of the recording for sleep analysis.
In this example the issue is intermittent and most of the signal is green.
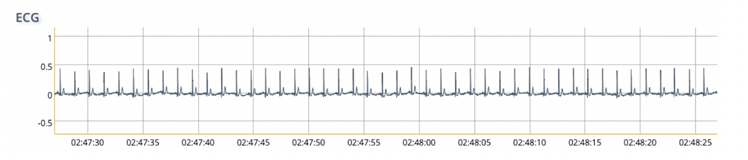
ECG & Respiration during a period of good signal
Premature Ventricular Contraction (PVC) / Ventricular Extra Systole (VES)
PVC/VES (Premature Ventricular Contraction / Ventricular Extra Systole), as with PACs are most often asymptomatic and are not considered an abnormal finding but, as they cause irregular heartbeat, they can interfere with CPC analysis and cause the Signal Quality to turn from green to yellow or red.
These ECG and Spectrogram examples are from a patient with known PVCs. The Signal Quality bar shows poor signal quality periods (yellow and red) during this sleep recording. In some cases, depending on severity, the irregularity in the heartbeat may affect the ECG-derived respiration (EDR).
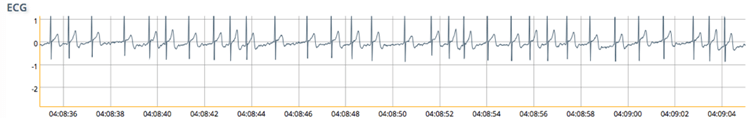
Signal Quality Green: period of good signal detection: 02:50 a
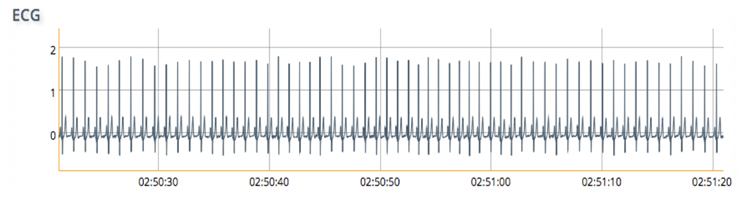
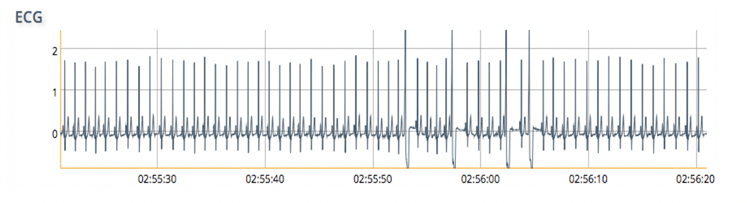
Signal Quality Green: some PVCs but not affecting results: 02:55 am
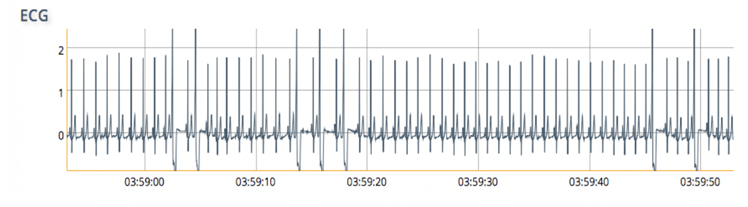
Signal Quality Yellow: 03:58 am
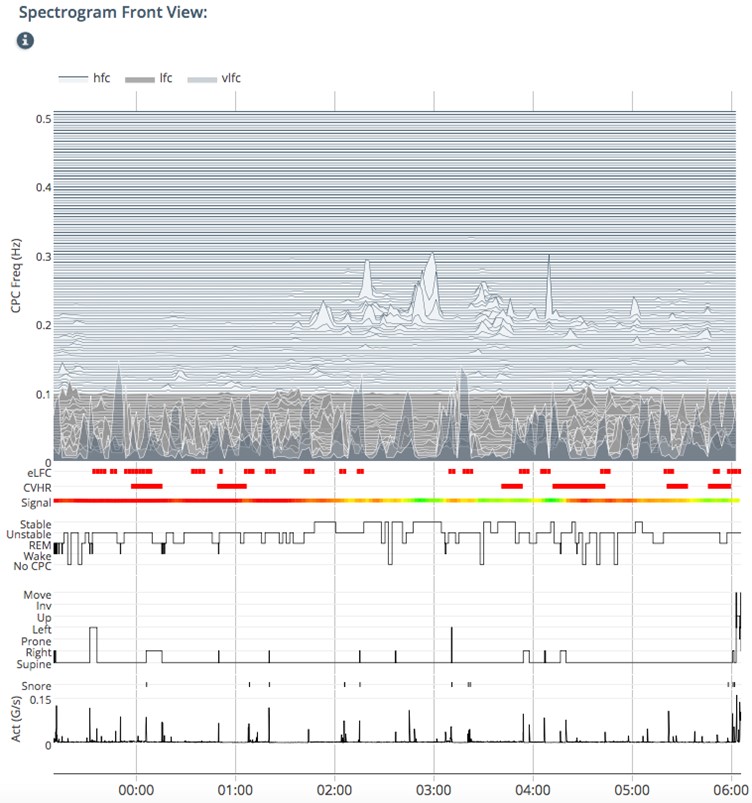
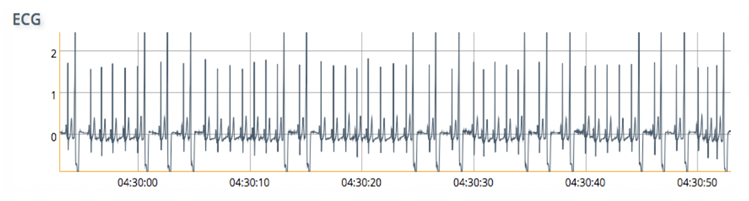
Signal Quality Red: frequent VES 04:08 am
PVC/VES may be perceived as a “skipped beat” or felt as palpitations in the chest and is a relatively common event where the heartbeat is initiated by Purkinje fibers in the ventricles rather than by the Sinoatrial node, the normal heartbeat initiator. The electrical events of the heart detected by the ECG allow PVC/VES to be easily distinguished from a normal heartbeat. Often PVC/VES are benign and may even be found in otherwise healthy hearts but can also be a sign of decreased oxygenation in the heart muscle.
Atrial Fibrillation (AFib)
When testing patients AF, great care must be taken when interpreting the results. The Signal Quality line will present as yellow or red depending on the severity of the condition, and as a result the spectrogram must be reviewed carefully before proceeding.
This example is from a patient with known continuous AF. The Signal Quality Line is red throughout. In severe cases of continuous AF such as this one, the irregular heart rate can pose challenges for ECG-feature detection, especially in the absence of a strong respiratory component (no SDB). As a result the Spectrogram will appear noisy (right).
In this case it is recommended to address the cardiac issues first and then follow-up testing later, or refer to a specialist if the patient was previously undiagnosed.
ECG from a patient with AF also shows evidence as a lack of a p-wave.
sleepimage (CPC) & psg
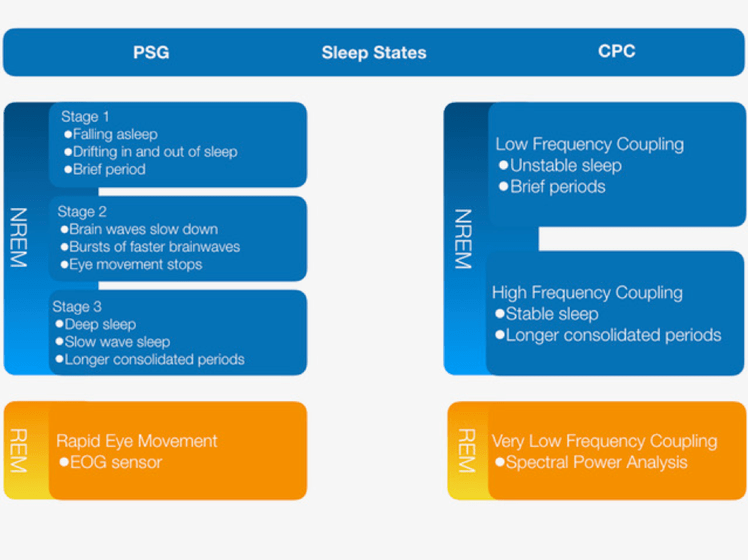
Over the last decades, Polysomnography (PSG) has been the most widely used clinical measure of sleep where sleep is described as NREM sleep and REM sleep based on Electroencephalogram (EEG) morphology. NREM sleep is presented in 3 sleep stages and REM sleep is also often referred to as dream sleep.
SleepImage, Cardiopulmonary Coupling (CPC) is based on the physiological changes in the autonomic nervous system that occur during sleep. It integrates information from the brain electrical activity through the autonomic nervous system. Analyzing heart rate variability (HRV) coupled with respiration, CPC captures the essence of sleep by looking at the ebb and flow of slow wave power that is the accepted marker of sleep drive in humans and in non-human species. The CPC-method does not rely on the same data streams as PSG and the output is not meant to match PSG, it however complements conventional sleep staging, albeit with a different method of categorizing sleep. Rather than being dependent on manual interpretation, primarily of EEG morphology, the automated output reveals that NREM sleep has a distinct bimodal-type structure marked by distinct alternating and abruptly varying periods of high and low frequency CPC-power. High frequency coupling (HFC) or stable sleep occurs during stage part of NREM-2 and all NREM-3 and is associated with periods of stable breathing, non-cyclic alternating pattern (n-CAP) EEG, increased absolute and relative delta power, strong sinus arrhythmia and blood pressure dipping. Conversely, low frequency coupling (LFC) or unstable sleep occurs during NREM-1 and part of NREM-2 and has opposite features and is characterized by temporal variability of tidal volumes, cyclic alternating pattern (CAP) EEG and non-dipping of blood pressure, lower frequency cyclic variation in heart rate. CPC defines REM sleep into Stable and Unstable REM sleep based on frequency analysis of how the dominant CPC state has been classified as vLFC, where fragmented REM sleep is often accompanied by elevated Low Frequency Coupling.
In a healthy sleep pattern, cycles between Stable, Unstable and REM sleep (NREM Stage 1, 2 and 3 & REM sleep cycles on PSG) occur every 30 – 90 minutes and approximately 4-8 cycles occur during an 8 hour healthy sleep period. The ratio of NREM sleep to REM sleep in each cycle varies during the course of the sleep period. The first episode of REM sleep may last only a few minutes, but time periods spent in REM sleep increase progressively over the sleep period, with the final period of REM sleep that may last up to 30 minutes. In summary, Stable NREM sleep (slow-wave sleep) is prominent in the first third of the night and REM sleep is prominent in the last third of the night.
Stable & Unstable Sleep (NREM sleep)
NREM Sleep accounts for 75-80% of the sleep time. During this phase, thinking and most physiological activities slow down, but movement can still occur.
Stage 1 NREM sleep = Unstable Sleep – accounts for 3-8% of total sleep period, each period is about 5-10 minutes long and occurs most frequently in the transition from wakefulness to the other sleep stages or following arousal during sleep. In stage 1 NREM sleep, alpha activity, which is characteristic of calm wakefulness, diminishes and low-voltage theta waves appear on EEG. While in stage 1 sleep, people lose awareness of their surroundings, but they are easy to wake up.
Stage 2 NREM sleep = Unstable & Stable Sleep – accounts for 45-55% of total sleep time. This is the first stage of effective sleep and each period lasts about 10-25 minutes. The characteristic EEG findings of this stage are sleep spindles believed to occur when the brain disconnects from outside sensory input and begins the process of memory consolidation and K complexes that are sort of built-in vigilance system that keep you poised to awake if necessary. Delta waves first appear during this period of sleep but are present in small amounts. Most people spend about half of the night in this stage, where eyes are still, and heart rate & breathing gradually slows down.
Stage 3 NREM sleep = Stable Sleep – accounts for 15-20% of the total sleep period. The characteristic EEG findings of this stage are that slow-brainwaves or Delta waves become dominant. The brain becomes less responsive to external stimuli, making it difficult to wake up the sleeper. Slow-wave sleep is the time for the body to renew and repair. During this sleep stage muscle tone decreases, breathing becomes more regular, blood pressure drops, and pulse rate slows. Blood flow is directed less toward the brain and at the beginning of this stage the pituitary gland releases a pulse of growth hormone (GH) that stimulates tissue growth. When a sleep deprived person gets some sleep, he or she will pass quickly through the lighter sleep stages, into the deeper sleep stages and spend a greater proportion of the sleep period in this stage. This is believed to indicate that slow-wave sleep has an essential role in a person’s optimal functioning.
REM sleep accounts for about 20% of the sleep time. Dreaming occurs during REM sleep. The first REM sleep episode occurs 60-90 minutes after the onset of NREM sleep. Characteristics of REM sleep is atonic of skeletal muscle groups, but the brain is actively thinking and dreaming as the eyes move back and forth behind closed eye lids, hence the name Rapid Eye Movements (REM). During this stage heart rate and blood pressure increase and respiration becomes irregular. Despite all this brain and eye activity, the body hardly moves, the motor function becomes “paralyzed”. Like Stable sleep (slow-wave sleep) restores the body, REM sleep or dream sleep restores the mind by facilitating learning and consolidating memories. When a person deprived of REM sleep falls asleep, he or she will enter REM sleep stage earlier and spend a higher proportion of sleep time in REM sleep.